#
How To Insert Chart?
- Click on insert menu.
- Click on chart and choose required one chart templates. Eg. Column
 |
| Chart |
- Click on ok then type the required data.
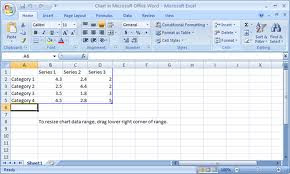 |
| Excel sheet |
- Close the excel sheet dialog box.
# How To Edit Data?
- Select required chart.
- Click on design menu.
- Click on edit data then type data.
 |
| Edit Data |
# How To Change Legend position?
- Select the data chart.
- Click on layout menu.
- Click on legend.
 |
| Legend Position |
- Choose required one option.
# How To Show Data Labels?
- Select the data chart.
- Click on layout menu.
- Click on data label .
 |
| Data Labels |
- Choose required one option.


No comments:
Post a Comment